Network truth.
Certified.
ANIP has evolved into a full AI operations suite: a central Agent console for service creation and certification, a live Log Console for operational evidence, and Analytics for network status, platform usage, and executive visibility.
The ANIP Suite
ANIP is no longer just a dashboard. It is a working operational platform composed of three connected applications that turn infrastructure telemetry, logs, MCP tools, and AI analysis into a certifiable view of service health.
Agent
The central console where services are listed, certified, analyzed, edited, and created. Agent includes an AI-guided wizard that researches integrations, identifies credentials, recommends health rules, and builds MCP-backed services.
Log Console
A live operational log interface for search, filtering, stats, and tailing. It gives ANIP raw evidence from syslog and infrastructure logs so AI analysis is grounded in actual events.
Analytics
An executive and operator view of network status, platform analytics, MCP tool usage, skill hit rate, most common questions, uptime trends, and certification history.
Agent: the control plane
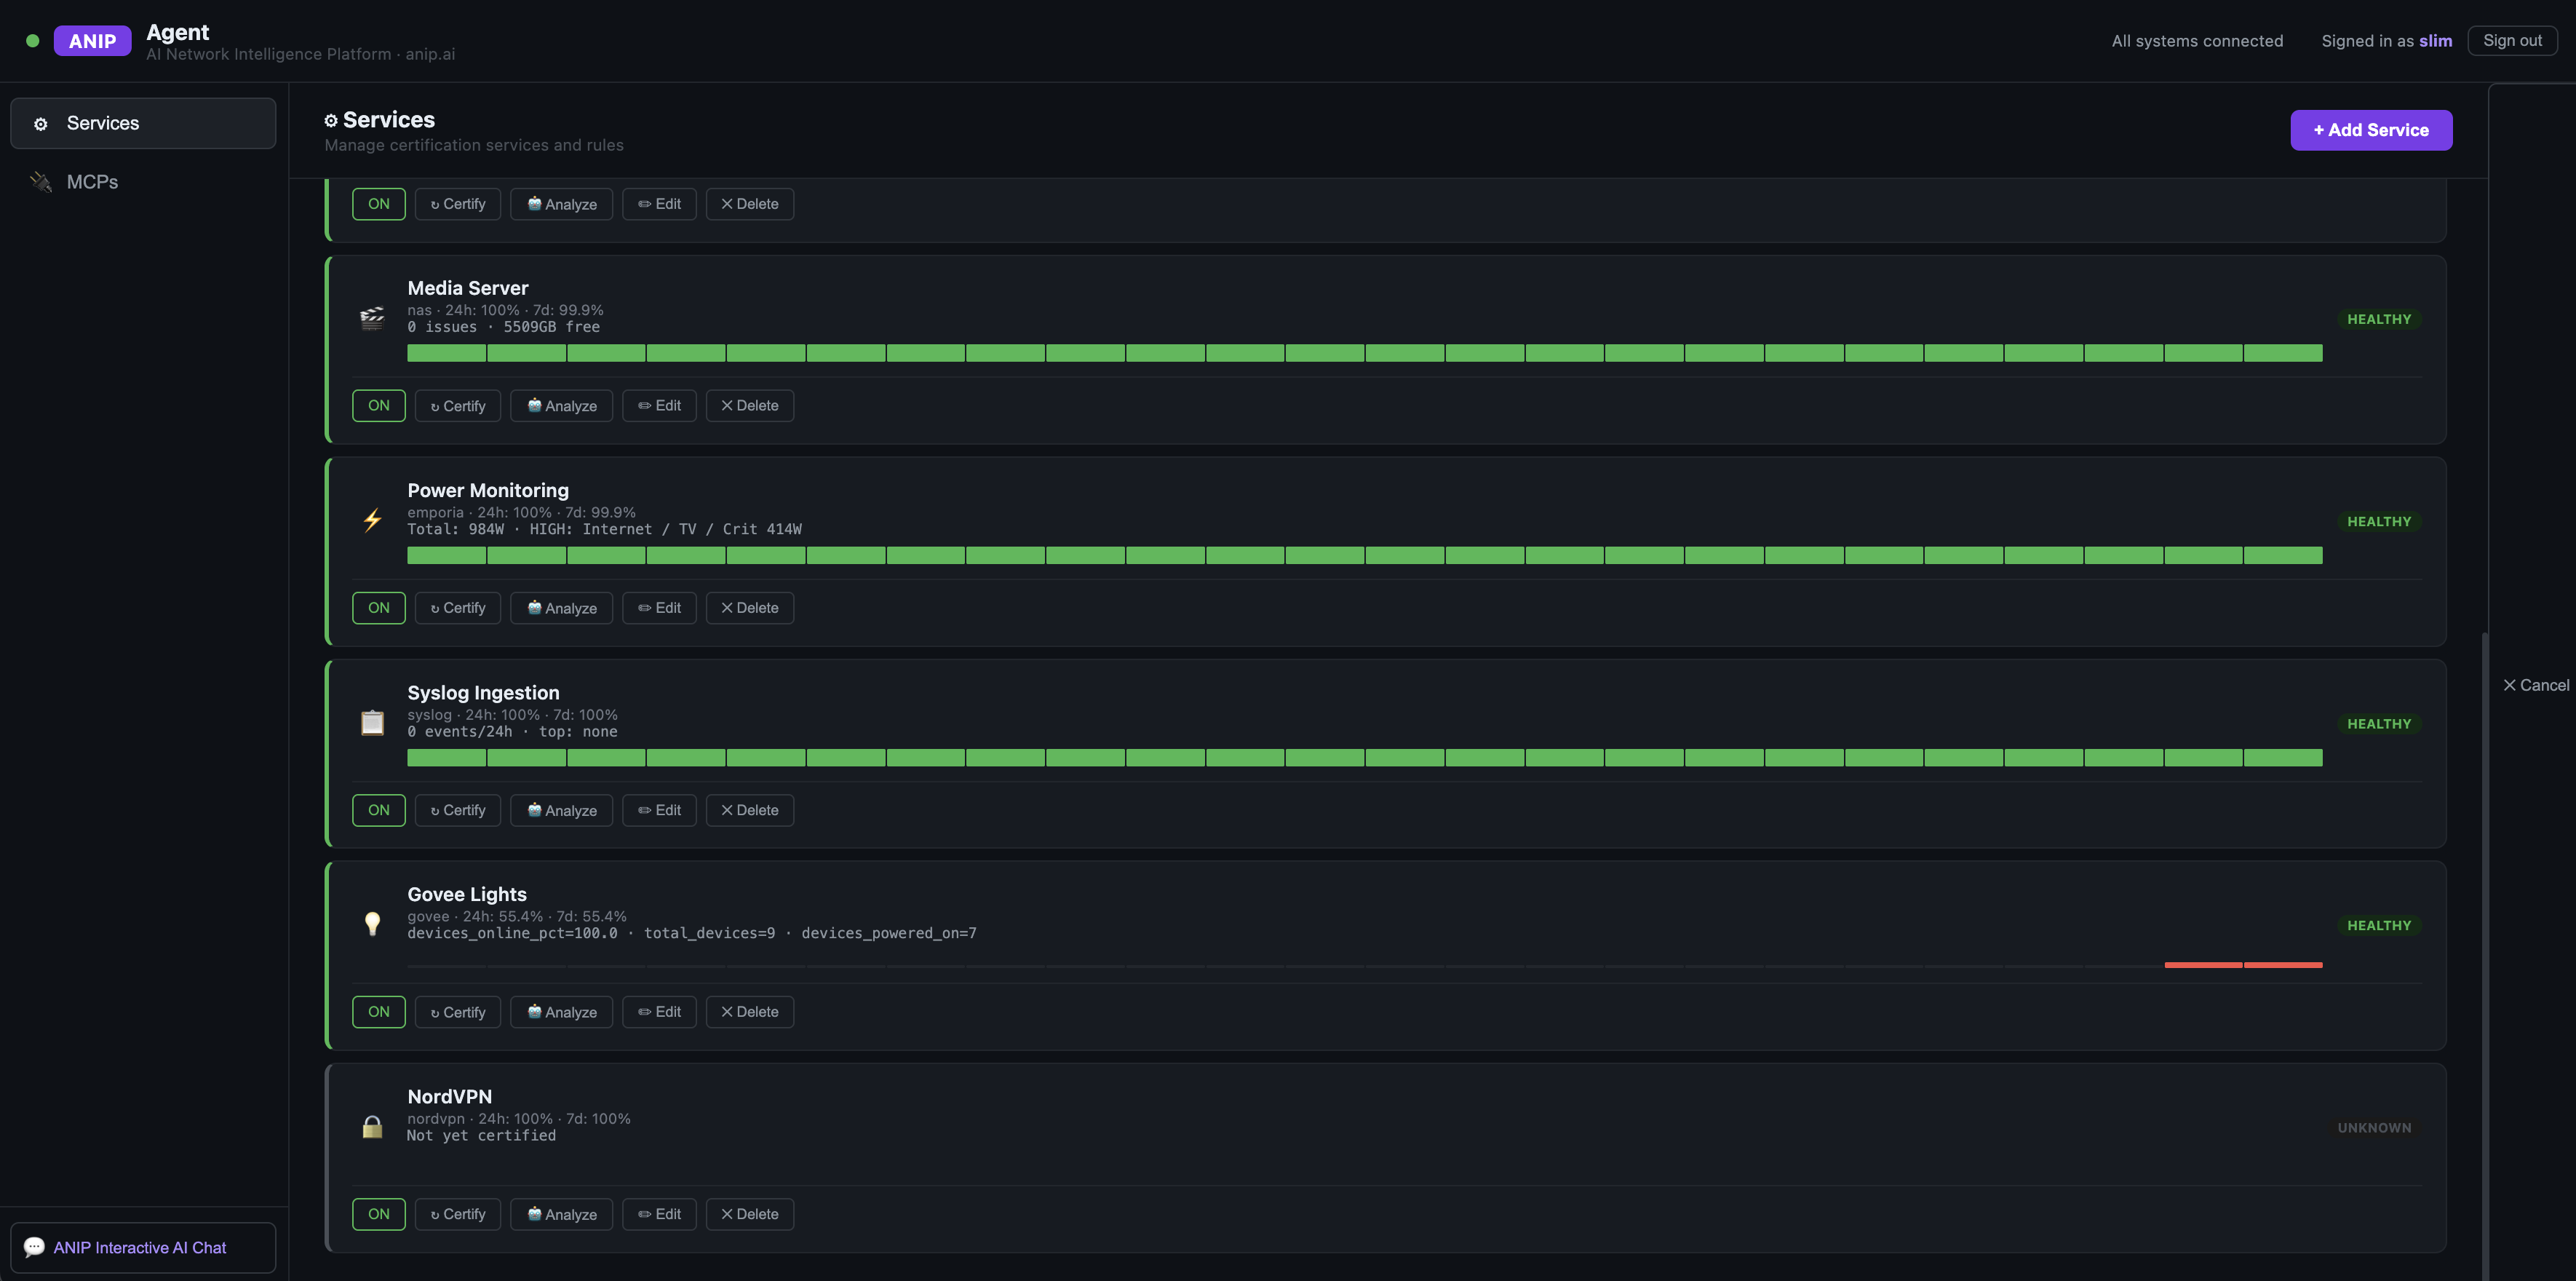
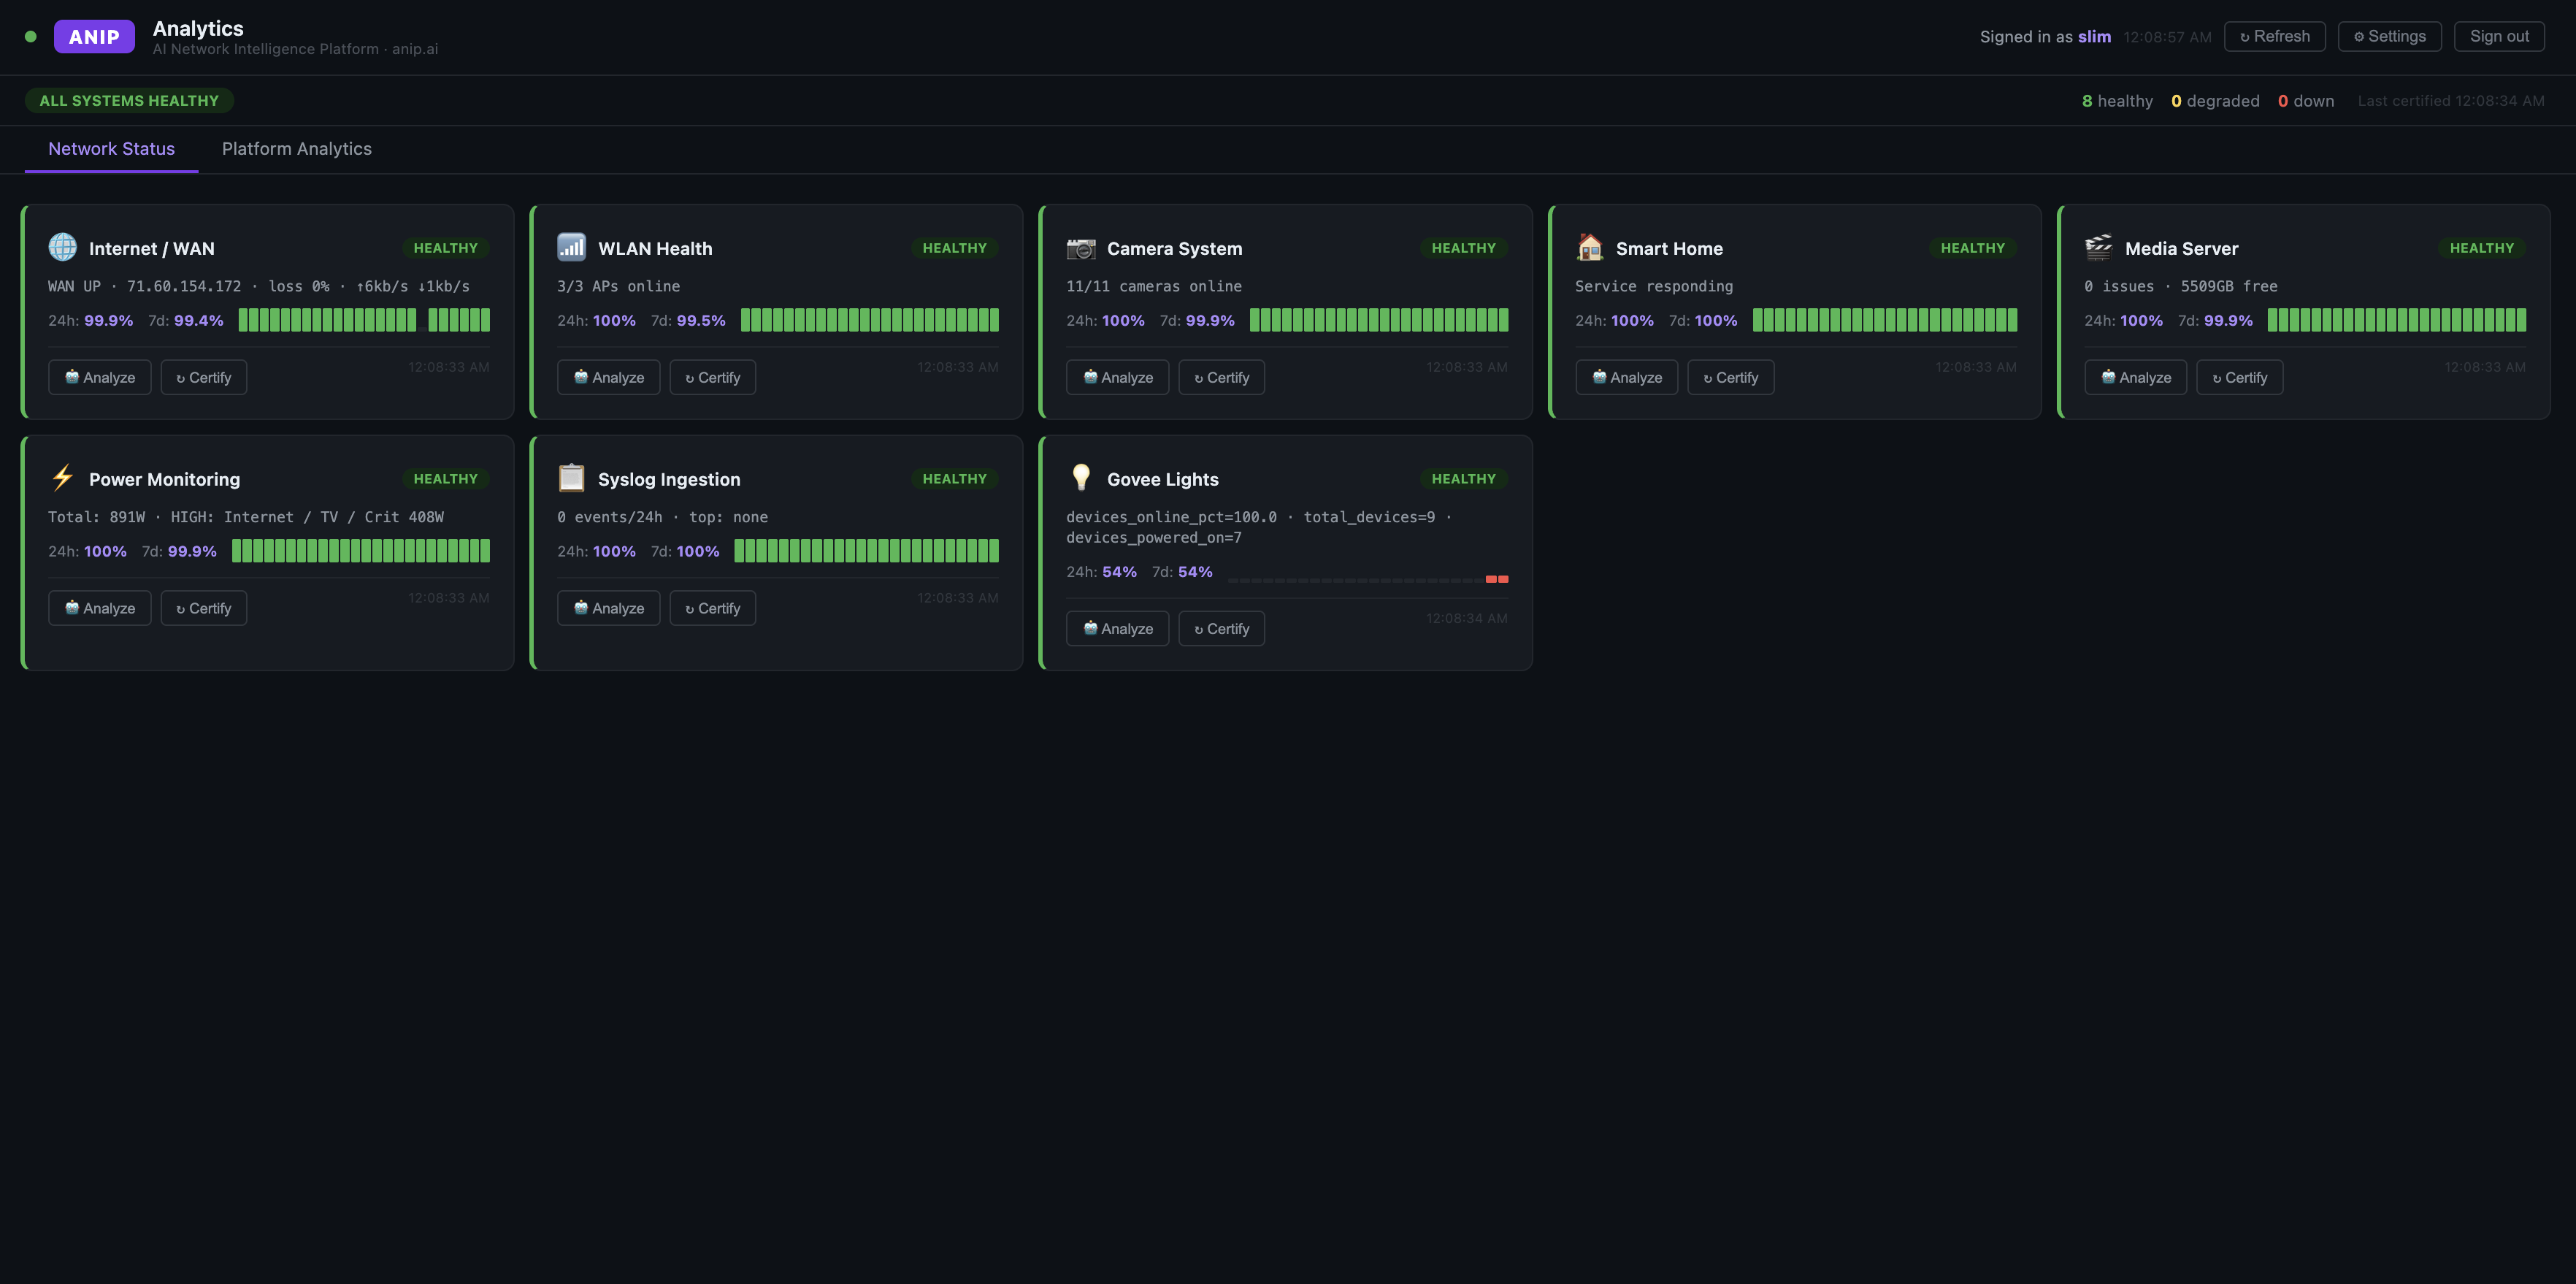
Agent is the central ANIP console. It shows every monitored service, its certification state, health windows, uptime bars, degradation signals, and actions for analyze, certify, edit, or delete.
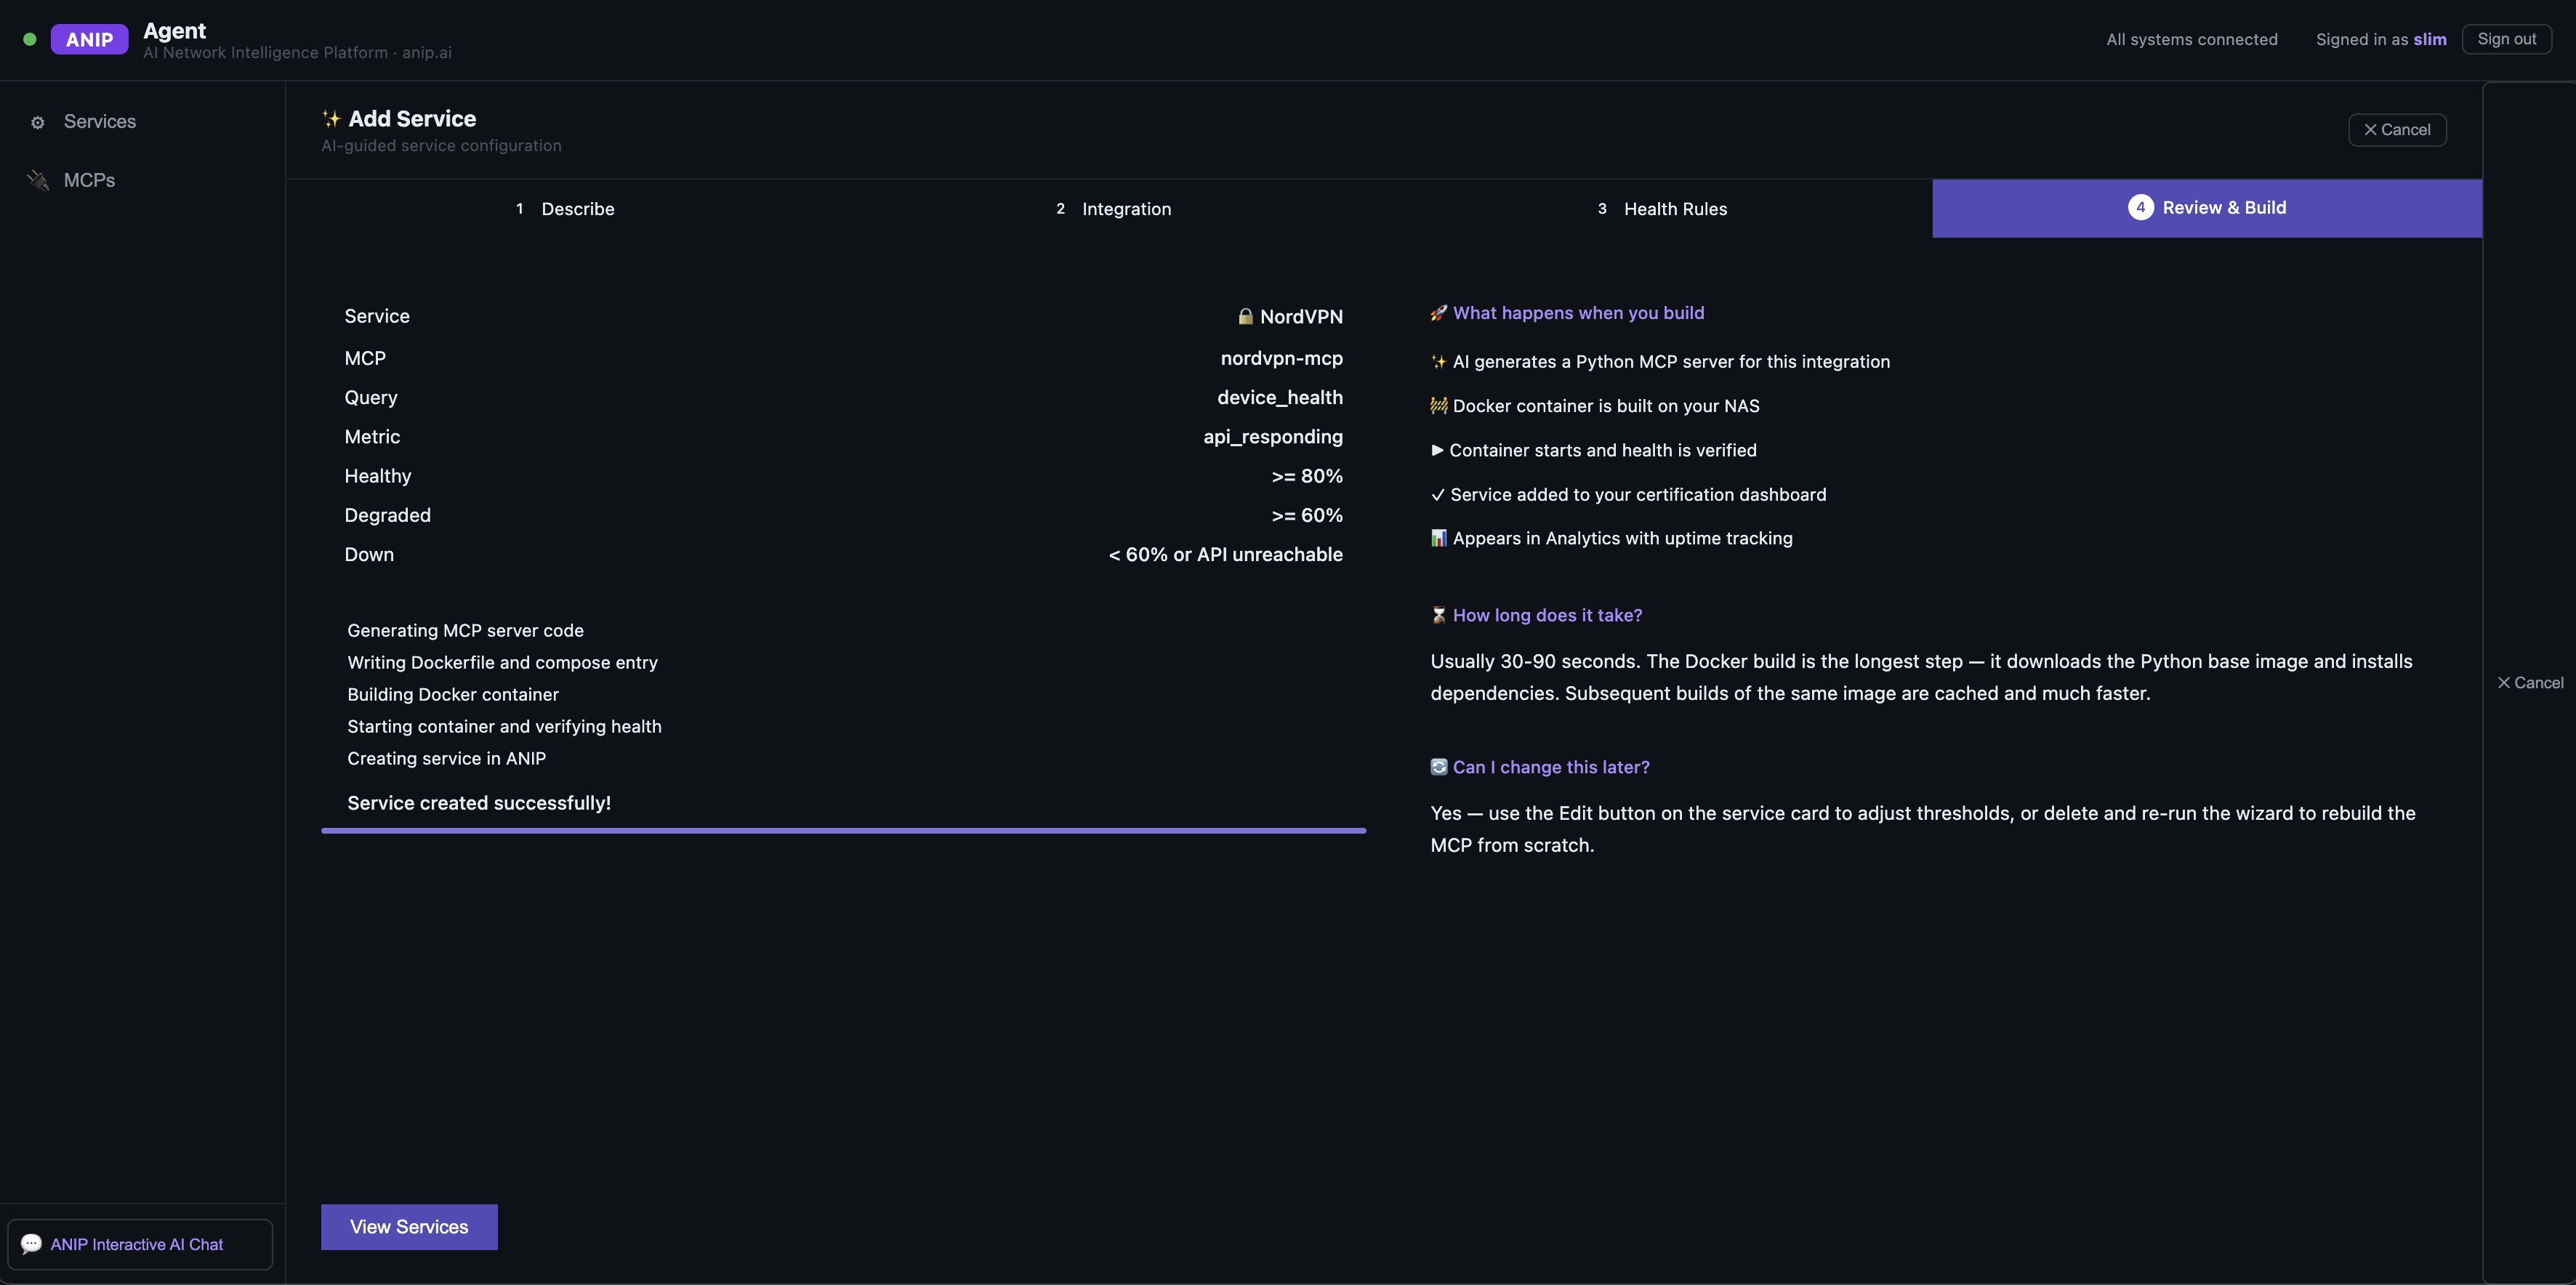
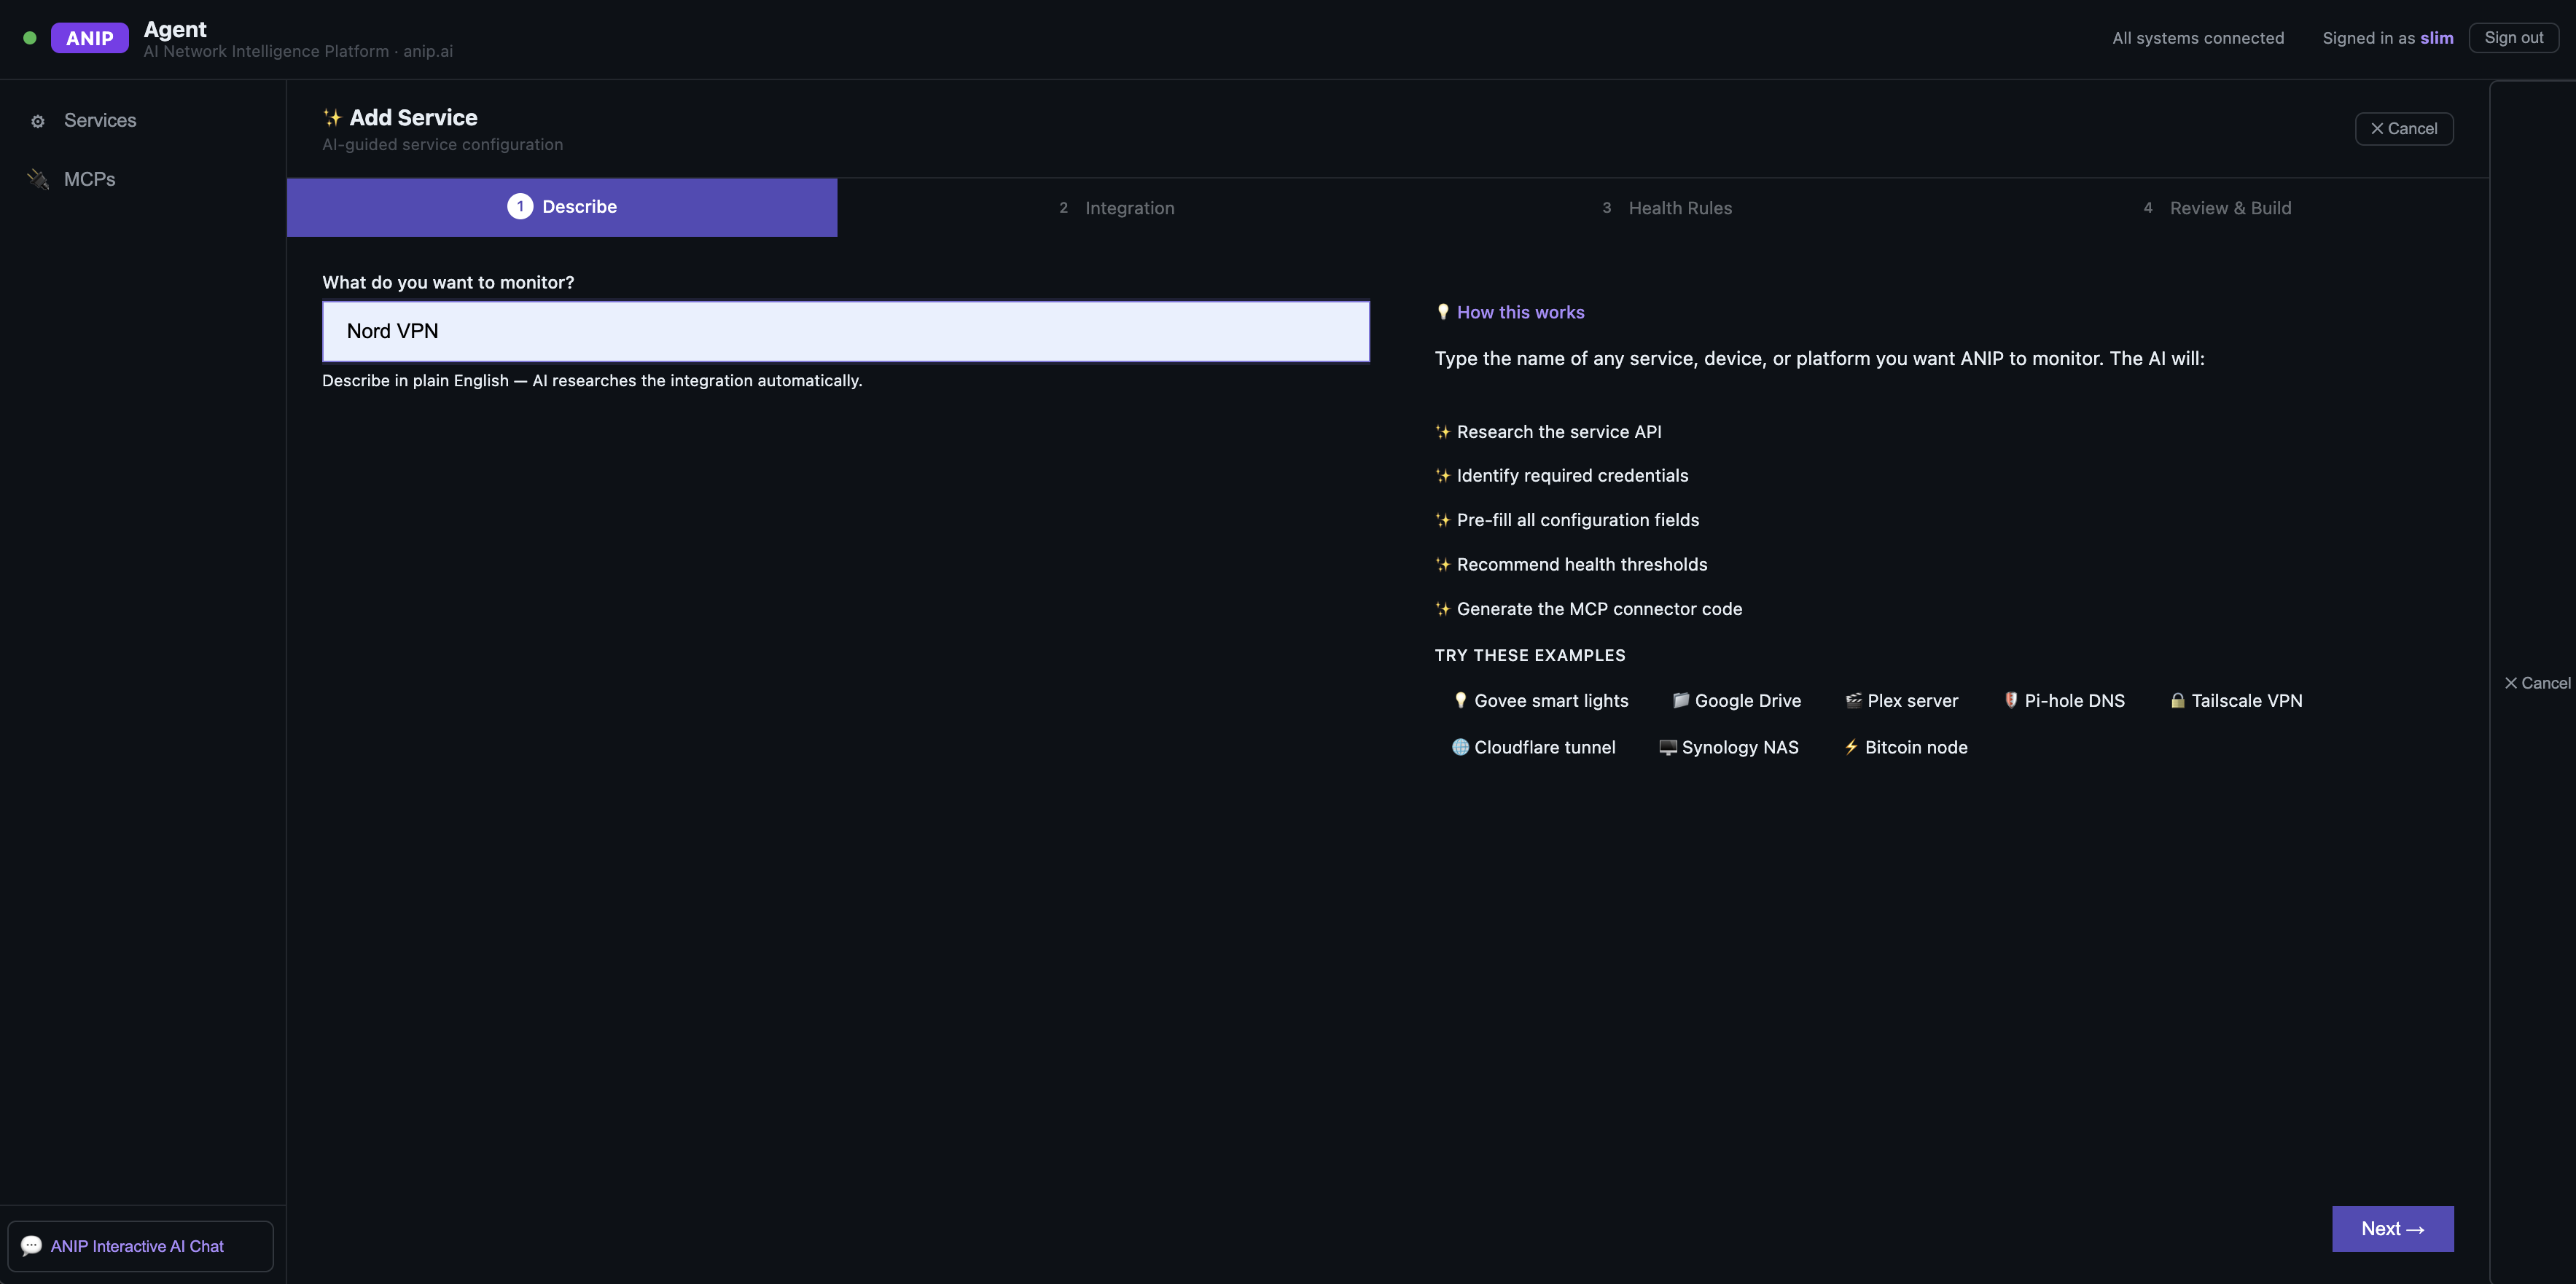
AI-guided service creation
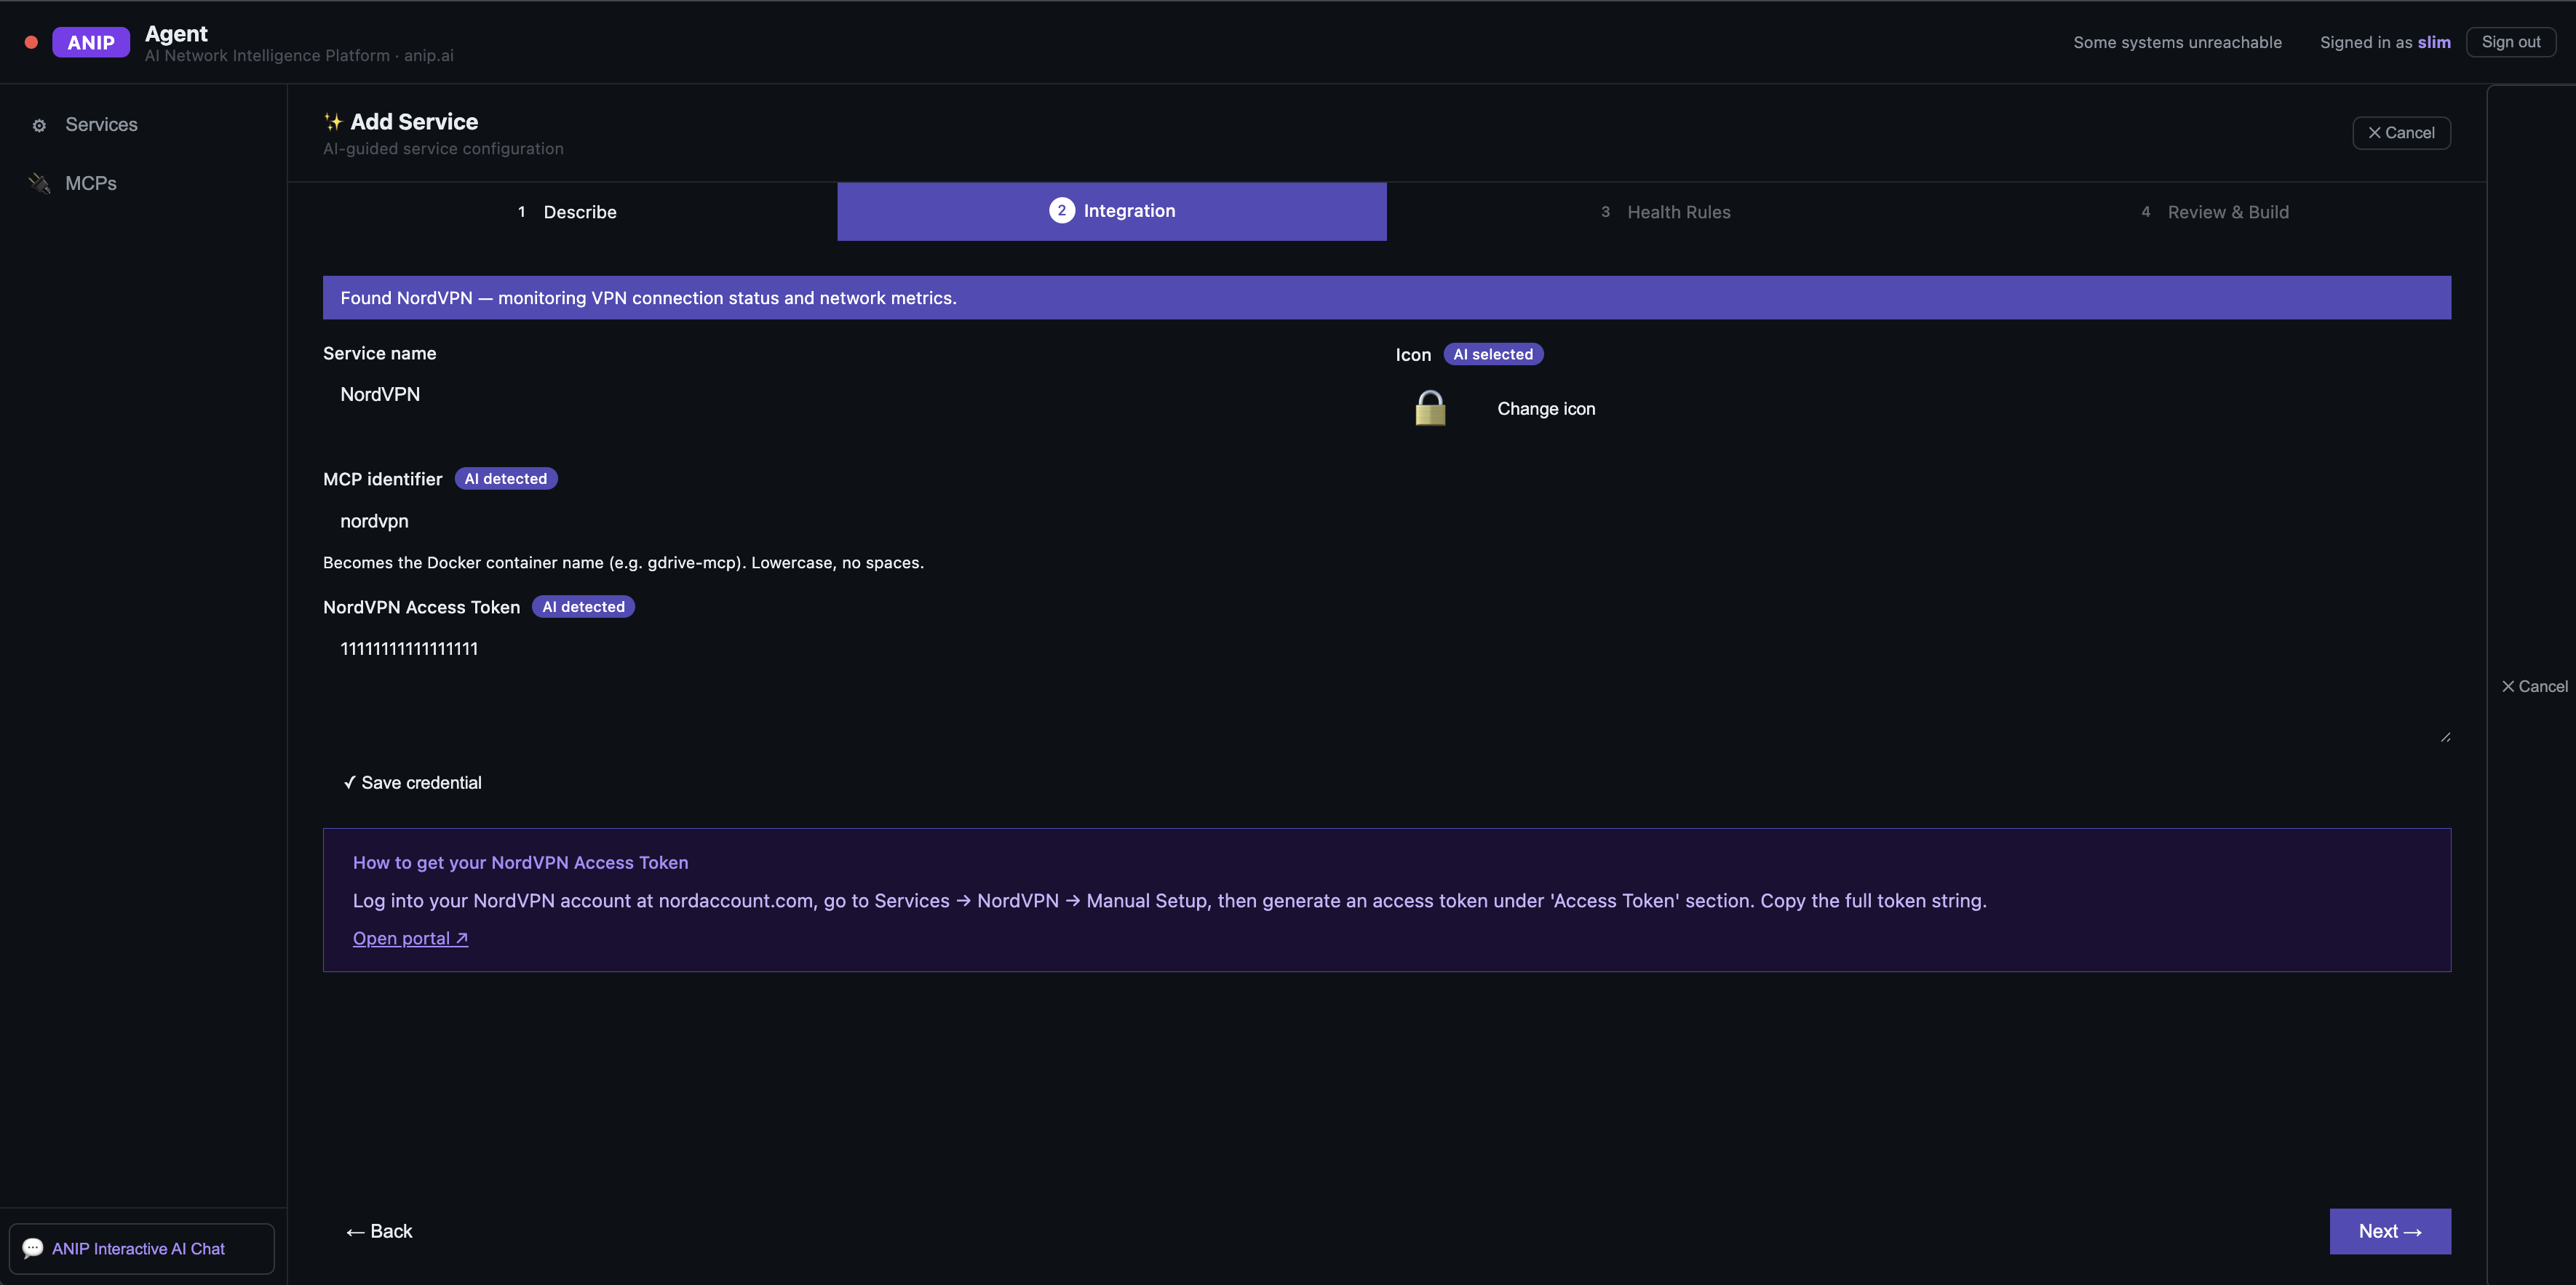
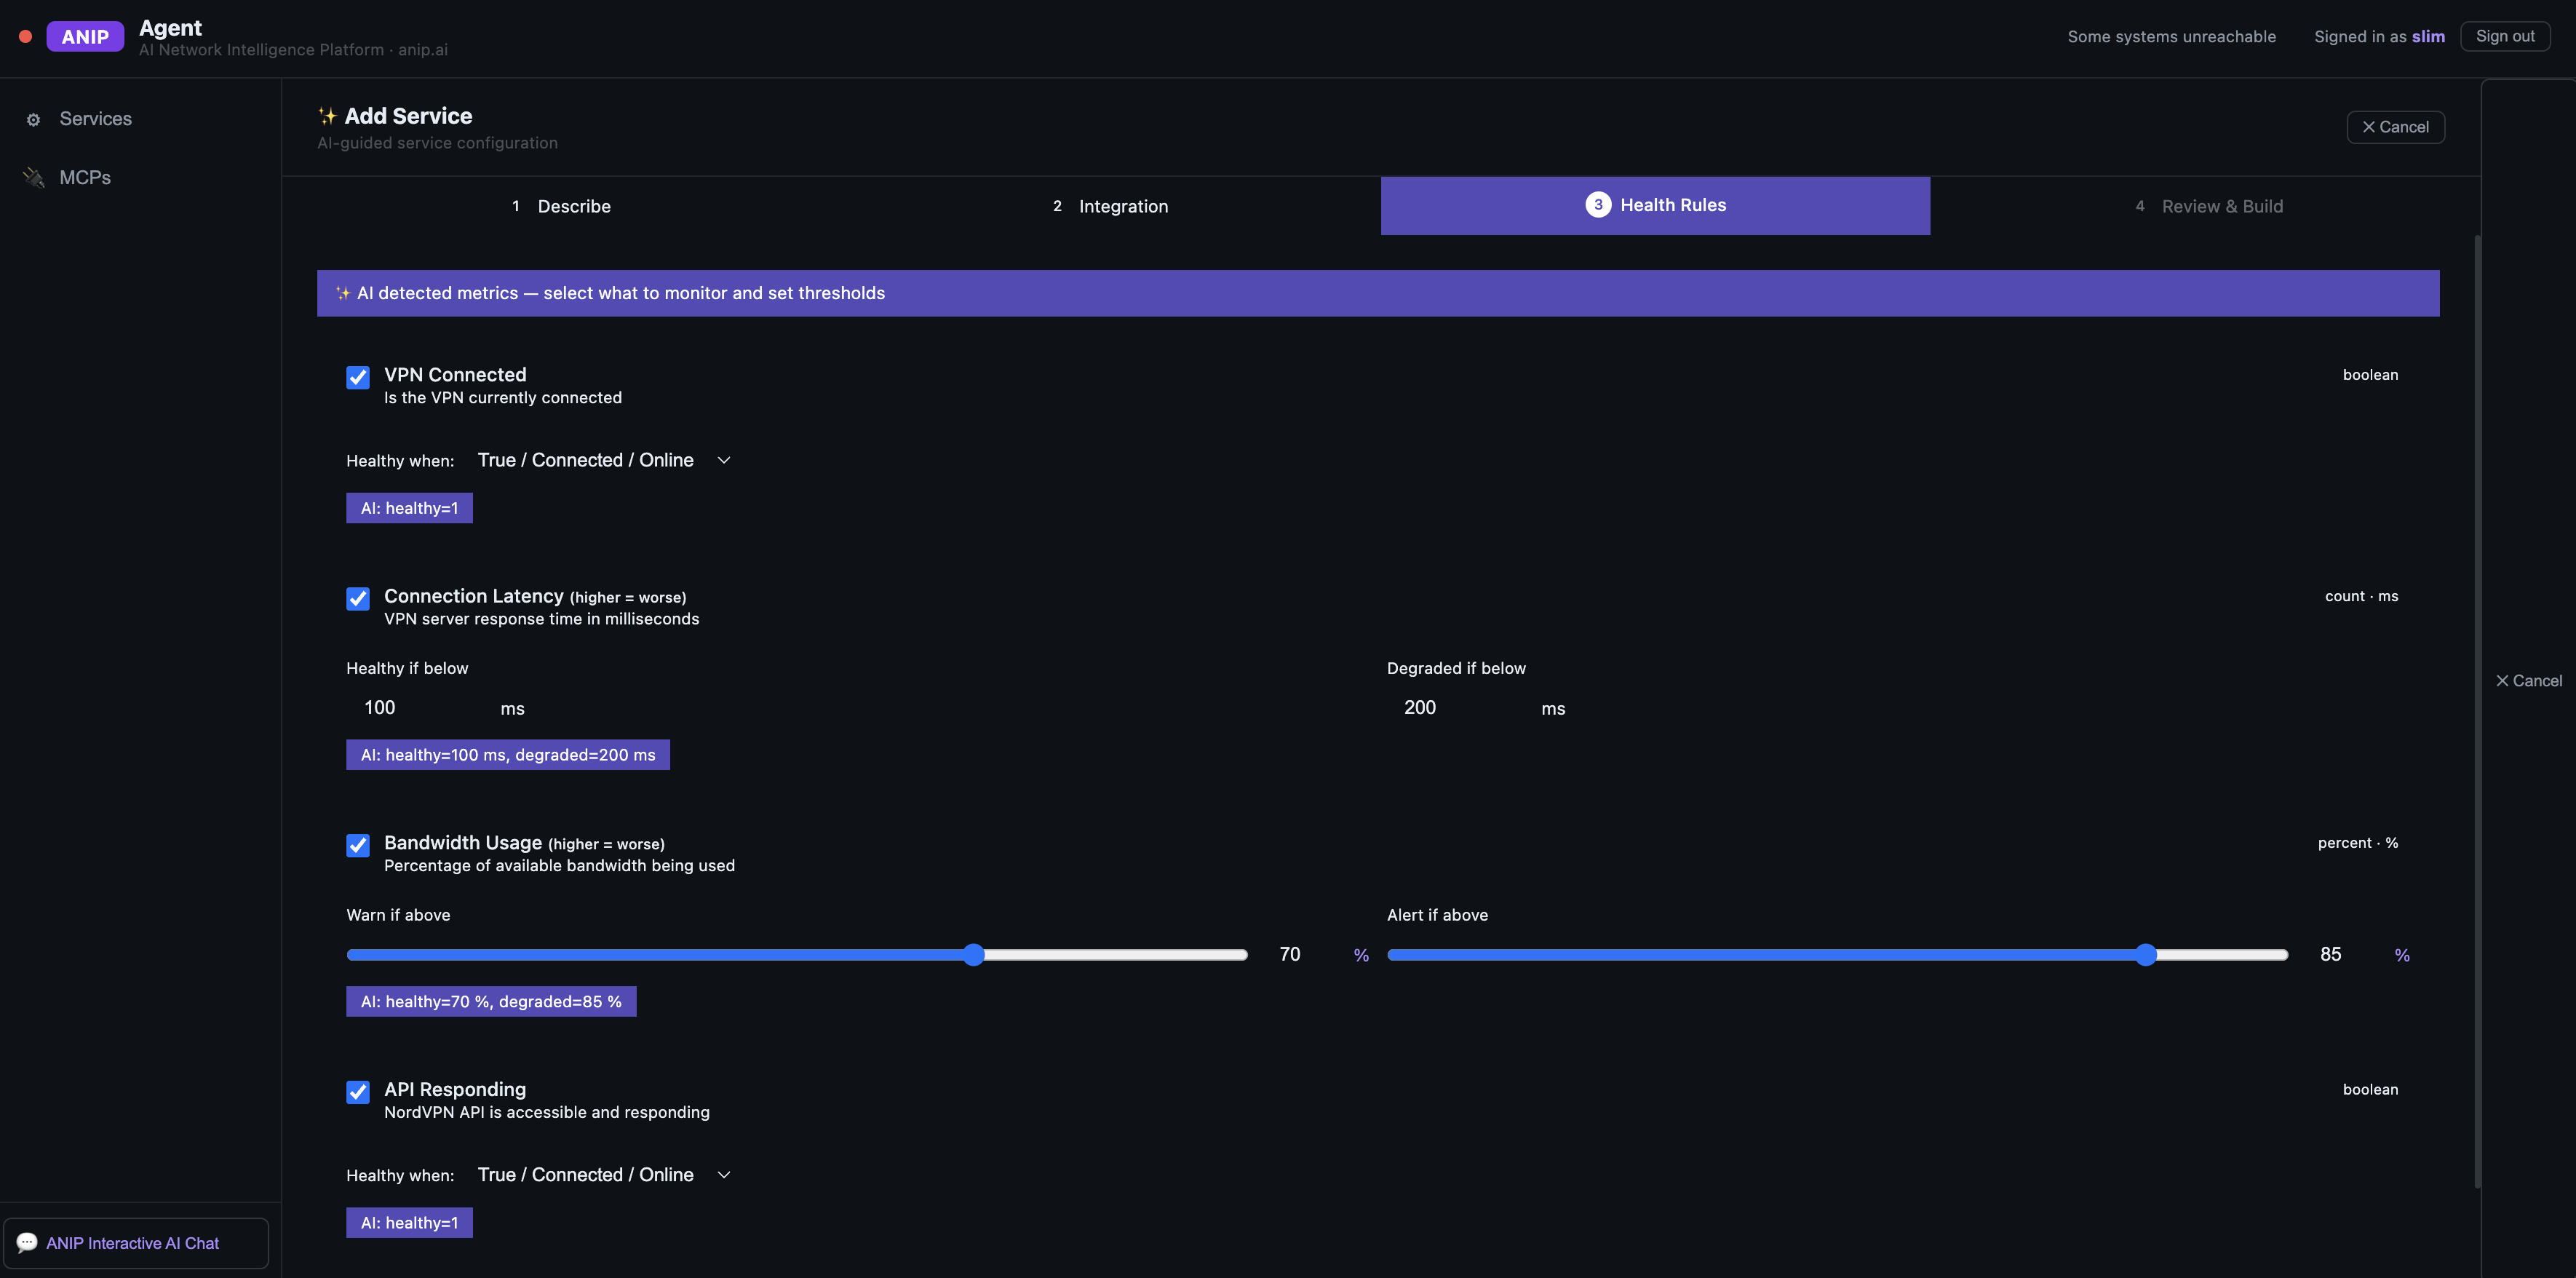
ANIP Agent now includes a wizard that lets a user describe any service, device, or platform in plain English. AI researches the integration, detects required credentials, proposes health thresholds, generates connector code, builds the Docker container, verifies health, and adds the service to the certification dashboard.
Log Console: operational evidence
The Log Console provides live tailing, search, filters, severity breakdown, hostname and program targeting, quick filters, stats, and dashboard views. It turns raw network and system logs into searchable operational context for the rest of ANIP.
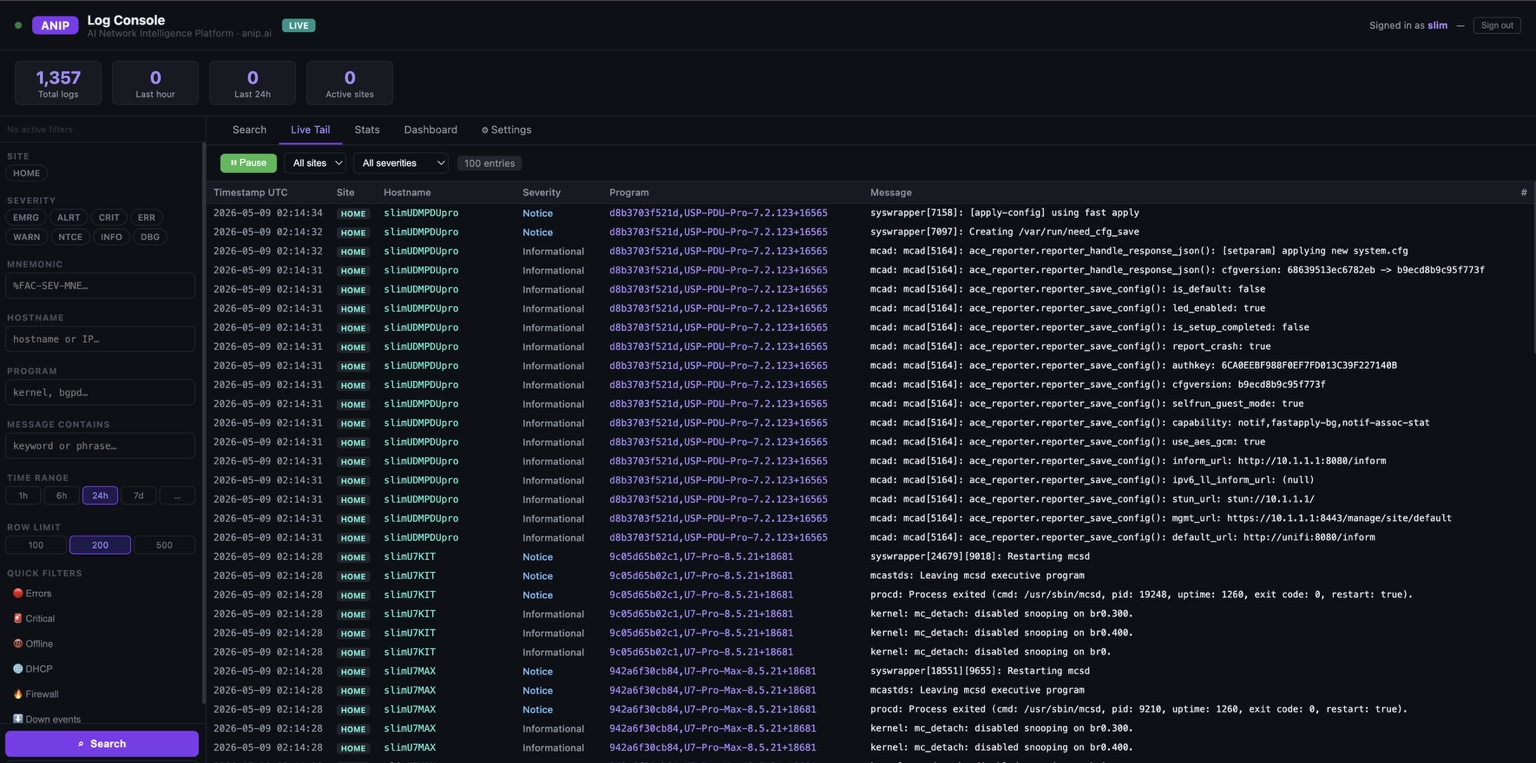
LIVE TAIL → syslog, kernel, mcad, syswrapper, DHCP, firewall, offline events
FILTERS   → site, severity, hostname, program, message contains, time range
OUTPUT    → searchable operational proof for AI analysis and certification
Analytics: intuitive platform intelligence
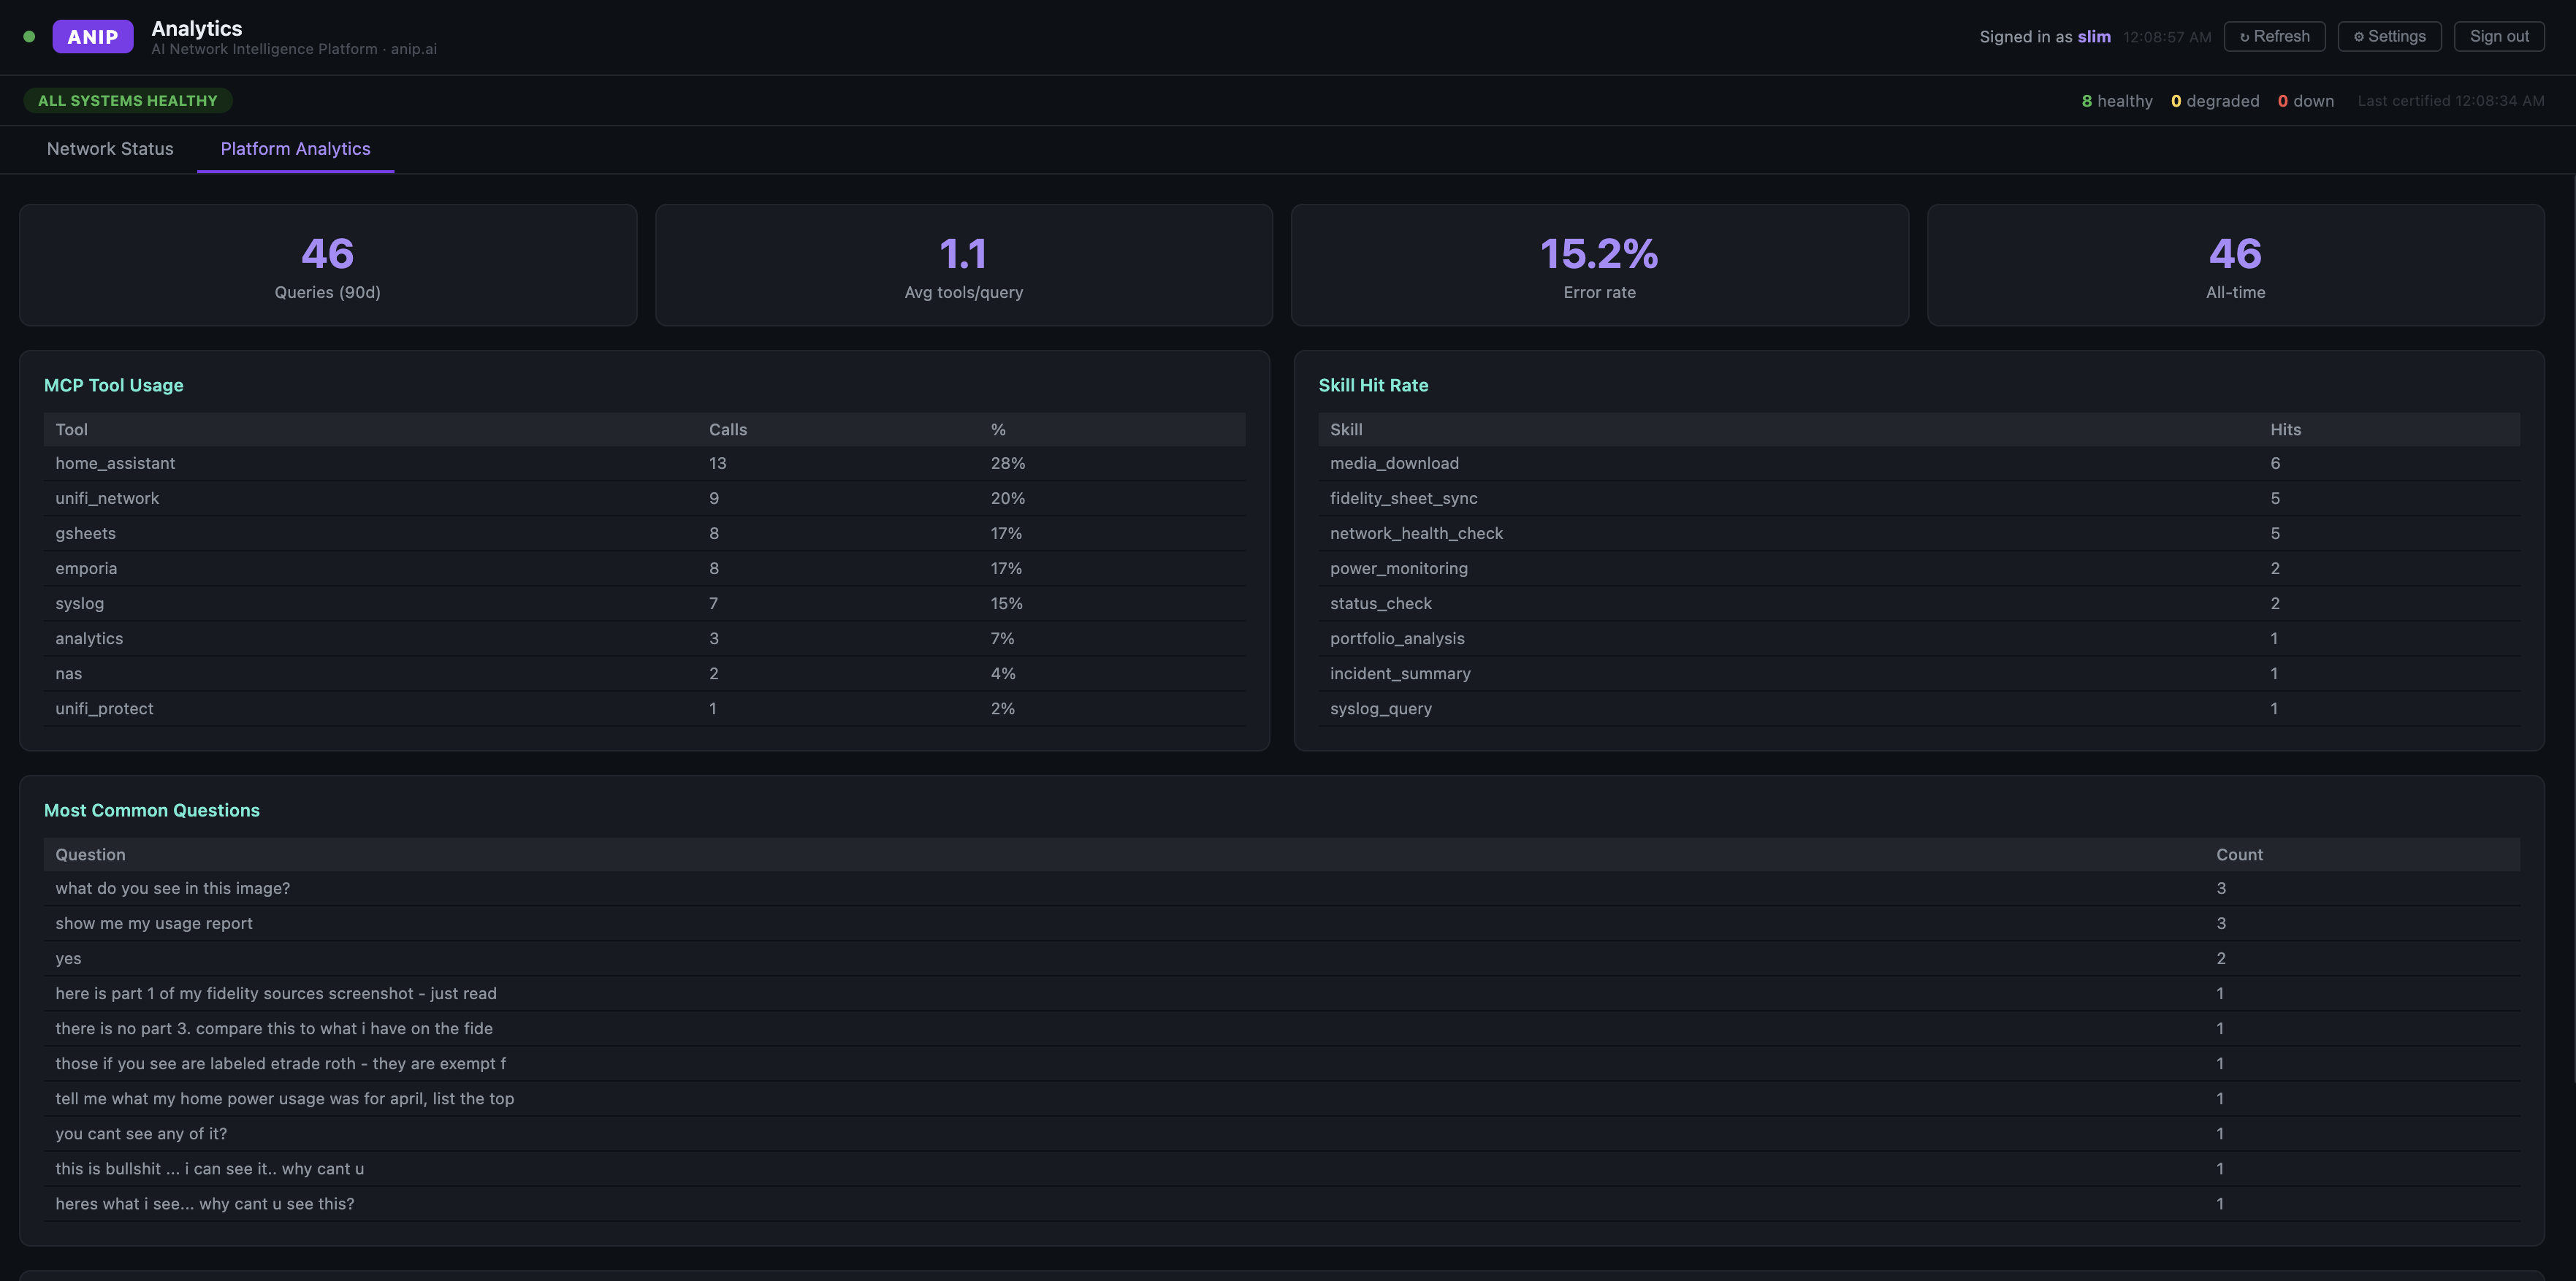
Analytics now separates network health from platform analytics. Operators can see service cards and health posture while leadership can review query volume, tool usage, error rate, skill hit rate, common questions, and all-time usage.
How the pieces fit
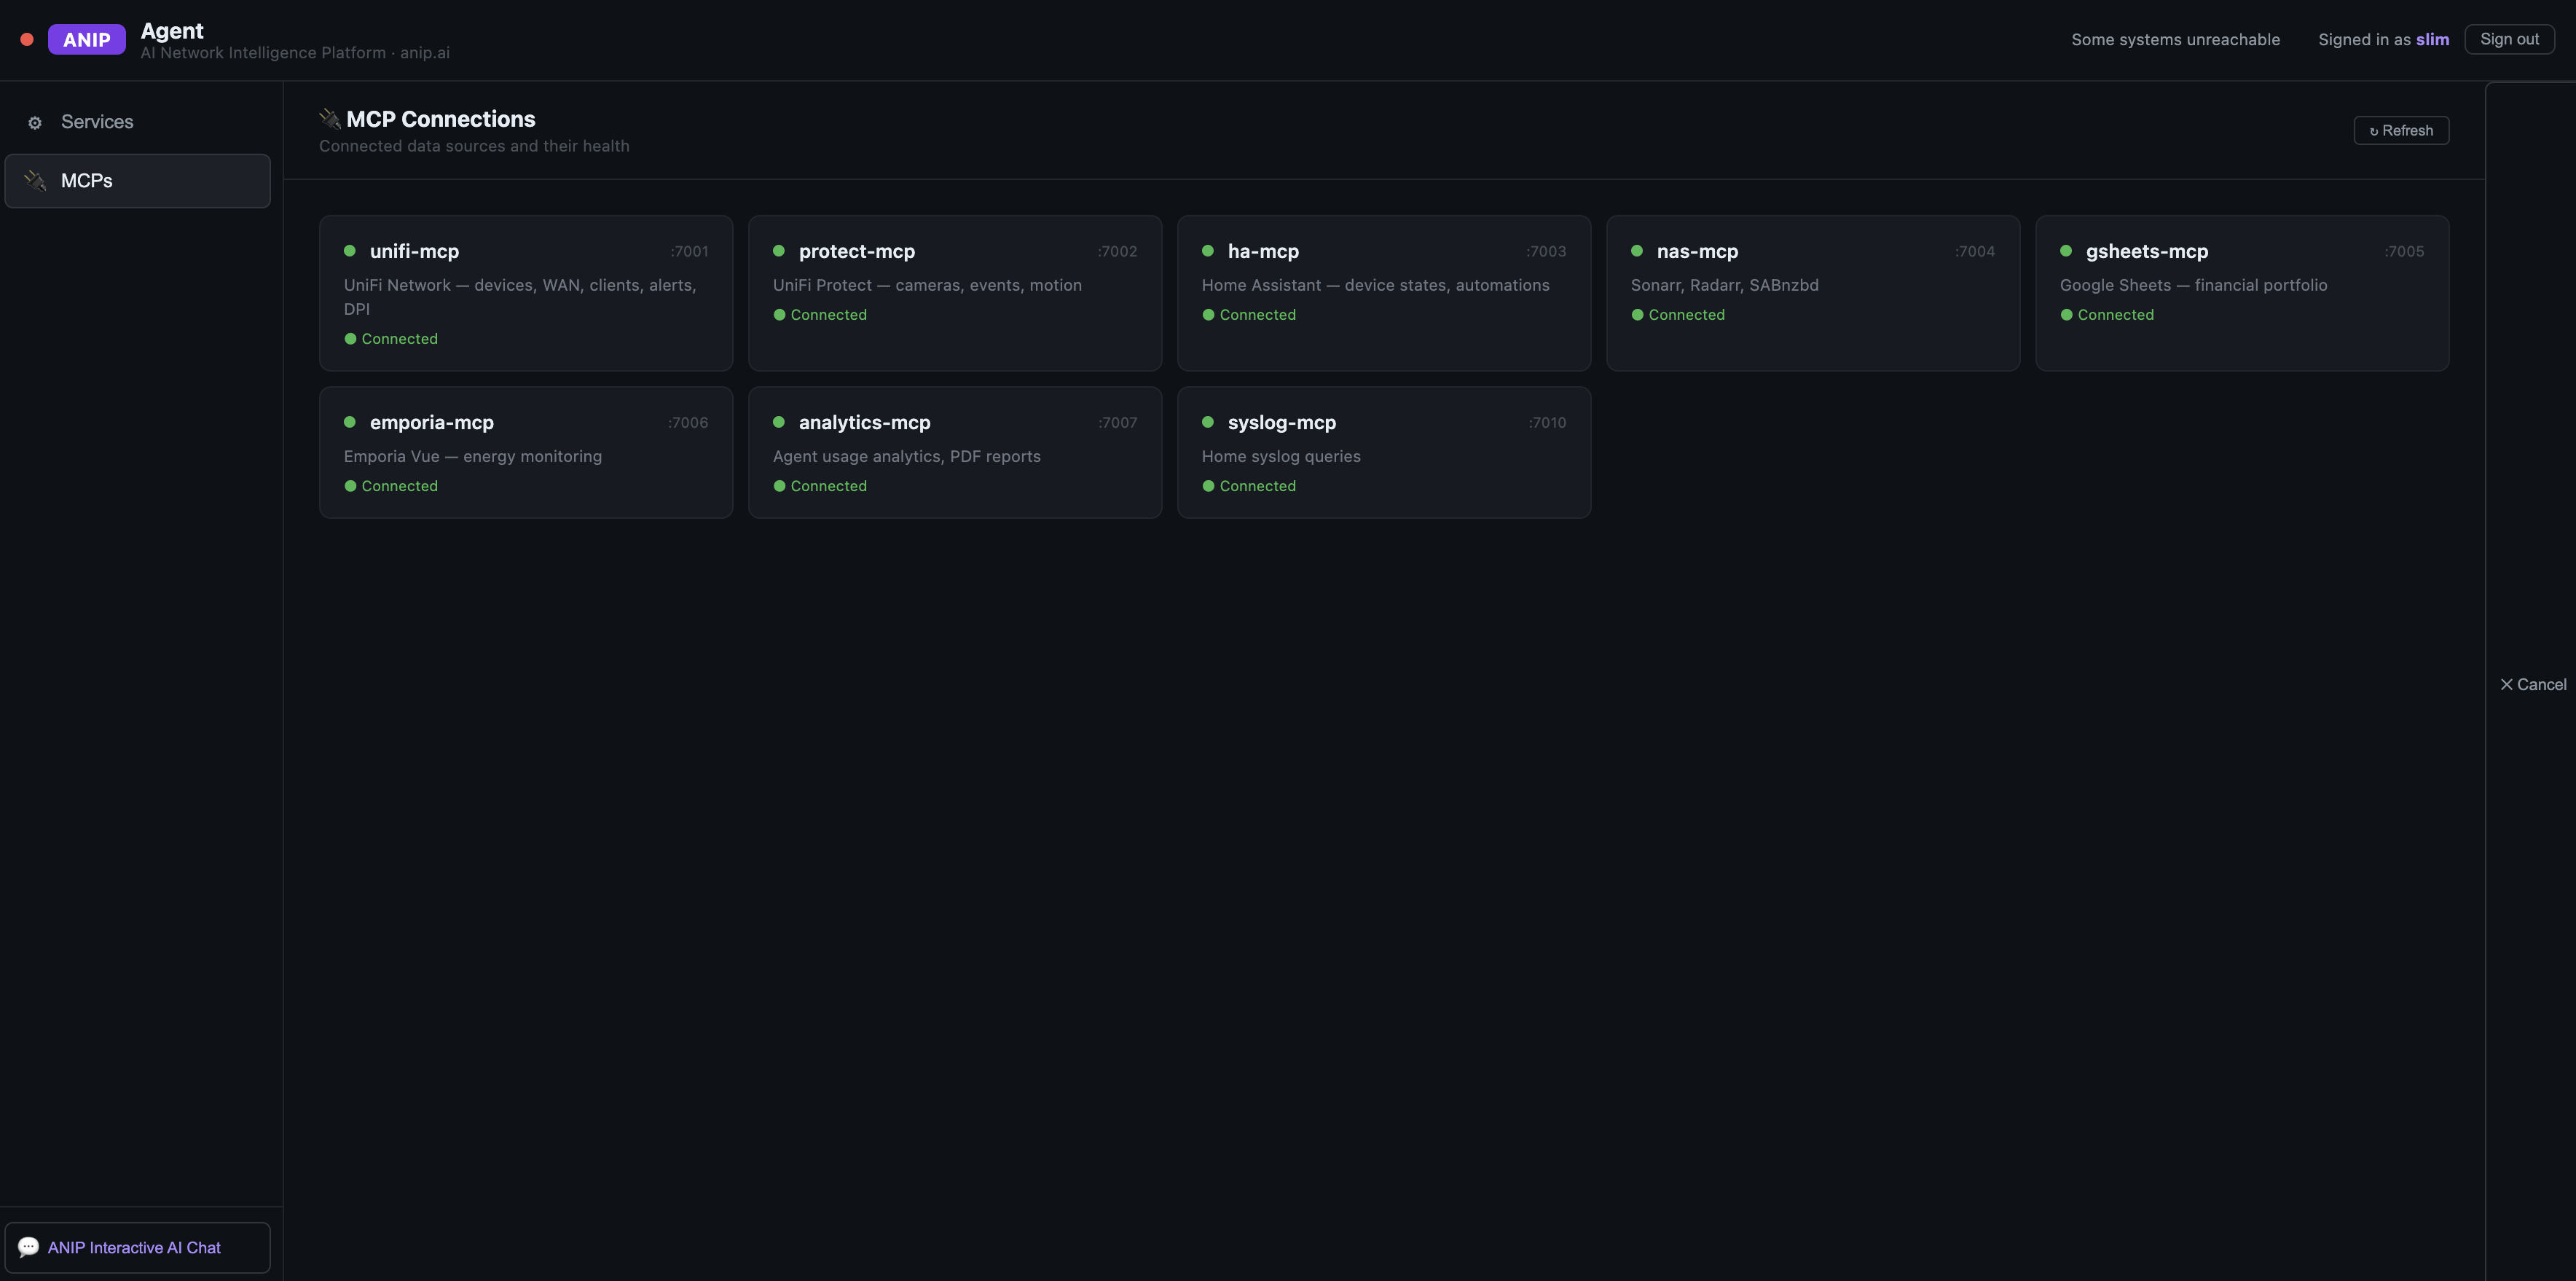
ANIP uses MCP-backed services as the data plane, Agent as the certification and creation plane, Log Console as the evidence plane, and Analytics as the visibility plane. The result is a single operating picture across network, smart home, media, power, storage, logs, and portfolio data sources.
MCP data plane
Connected MCPs expose UniFi, Protect, Home Assistant, NAS, Google Sheets, Emporia, Analytics, and Syslog data to ANIP.
Certification engine
Services are evaluated with AI-selected metrics, thresholds, uptime windows, and pass/fail/degraded states.
Build pipeline
AI-generated MCP service code is packaged into Docker containers, deployed on the NAS, started, and verified.
AI assistant layer
ANIP Interactive AI Chat can answer operational questions using the available MCP tools, logs, and analytics context.
Health timeline
Services display 24-hour and 7-day status, uptime bars, degradations, down events, and last certification time.
Executive KPIs
Query volume, tools per query, error rate, all-time count, skill hits, and common questions show platform adoption and value.
From telemetry to operational truth.
ANIP combines AI, MCP tools, live logs, health rules, service certification, and analytics into a working AI Network Intelligence Platform — built to show what is healthy, what is degraded, what changed, and why it matters.